Introducing Qonto’s Prometheus RDS Exporter – An Open Source Solution to Enhance Monitoring Amazon RDS
February 3, 2025Databases are a critical part of most applications and essential to business continuity. To ensure performance, availability, and scalability, Amazon Relational Database Service (Amazon RDS) administrators typically monitor various metrics, such as the usage of CPU, RAM, IOPS, storage, or service quotas. Today, these metrics are found in several AWS services such as Amazon CloudWatch metrics, Amazon Elastic Compute Cloud (Amazon EC2), Amazon RDS, or Service Quotas. Medium to large scale companies usually have tens or hundreds of databases to monitor. Having a standardized approach to database monitoring can help administrators save time and help scale the business with lower risk. In November 2023, the Qonto SRE team published a unified framework for Amazon RDS monitoring which helps them deploy best practices at scale and monitor hundreds of databases with limited effort.
Qonto is a leading payment institution that offers a panel of banking services to small businesses with simplicity in mind. More than 450,000 companies have used Qonto in 2024. Qonto helps entrepreneurs focus on what matters the most for them: their core business. They have created automated tools that help companies motor through their accounting and expenses.
In this blog, you will learn how Qonto created the Prometheus RDS Exporter for Amazon RDS monitoring and why they decided to share it with the open source community under an MIT license. Qonto was looking for a solution to aggregate Amazon RDS key metrics and push them into Prometheus for monitoring and alerting purposes. This solution is RDS engine agnostic.
Since December 1, 2024, Amazon Aurora PostgreSQL-compatible and Amazon Aurora MySQL-compatible users can leverage Amazon Cloudwatch Database Insights. It is a database observability solution that provides a curated experience designed for DevOps engineers, application developers, and database administrators (DBAs) to expedite database troubleshooting and gain a holistic view into their database fleet health.
Finally, Amazon CloudWatch Database Insights is a fully managed solution while Prometheus RDS Exporter is a self-hosted open source observabillity solution. In this blog, we will demonstrate how to set up the Prometheus RDS Exporter.
Overview of solution
The Prometheus RDS Exporter combines four different AWS APIs:
- Amazon RDS to collect instance inventory and settings
- Amazon CloudWatch to collect instance consumption metrics
- Amazon EC2 to collect physical instance capacity (e.g., number of vCPU, max IOPS, etc.)
- Service Quotas to keep track and anticipate limit exceeded errors (e.g., available storage).
For metrics that are not available as an API, Qonto integrated AWS logic. For instance, finding the disk IOPS limit requires business logic as shown here:
The inventory, consumption, settings and quotas metrics have been consolidated into Qonto’s Prometheus RDS Exporter open source project. For a comprehensive view, the project also includes Qonto’s Grafana dashboards to fully leverage all these metrics and quickly visualize any and all issues with your Amazon RDS instances at a glance.
For a fully integrated solution suitable for production, which has been meticulously crafted by SREs, Qonto’s Database Monitoring Framework provides the 30 alerts that all Amazon RDS customers should enable, with documented runbooks explaining how to handle alerts.
Solution
The solution targets container environments, but could be deployed with Amazon EC2 instances as well. In this blog post, we’ll deploy the solution in a Kubernetes environment, assuming the Amazon Elastic Kubernetes Service (Amazon EKS) cluster, Prometheus operator, and Grafana are already deployed.
Prerequisites:
- Have an AWS account with admin access.
- Install the following tools on your dev environment: Helm 3.9+, kubectl, eksctl, and awscli.
- Have access to a functioning Amazon EKS cluster. To deploy one, see Getting started with Amazon EKS.
- Have Prometheus Operator installed on the EKS cluster.
- Have a fully functioning Grafana instance deployed. It is recommended to host it in the Amazon EKS cluster.
Step 1: Create an AWS Identity and Access Management (IAM) policy
Through your dev environment and with AWS Command Line Interface (AWS CLI), create an IAM policy with required permissions to fetch the different AWS APIs.
Step 2: Create an IAM role and Kubernetes service account
The Kubernetes pod running the Prometheus RDS Exporter will use a Kubernetes Service Account to use the IAM policy established in the preceding step. As a security best practice, the exporter will use IAM Roles for Service Accounts (IRSA) to pass IAM credentials to the RDS exporter. Create an IAM role and a Kubernetes Service Account for the Prometheus RDS Exporter:
This is the default role for the Prometheus RDS Exporter:
Step 3: Deploy the Prometheus RDS Exporter
Next, deploy the Prometheus RDS Exporter using the official Helm chart available in the Amazon Elastic Container Registry (Amazon ECR) public gallery. The Helm chart deploys the Prometheus RDS Exporter and a Prometheus ServiceMonitor custom resource that instructs the Prometheus server to auto discover the Prometheus RDS Exporter and collect its metrics. Deploy the Prometheus RDS Exporter with the following commands:
After a few minutes, Amazon RDS metrics should be available in your Prometheus server. From the Prometheus server CLI, you can execute the following Prometheus query to see the first metrics:
You can also navigate to the graphical interface located on http://localhost:9090/
Step 4: Install Grafana dashboards
On your Grafana deployment, in order to visualize the Amazon RDS metrics, you have to import the following Grafana dashboards:
- RDS instances: Inventory of your Amazon RDS instances
- RDS instance details: Advanced dashboard of an Amazon RDS instance
- Prometheus RDS exporter: See exporter internal metrics
You can import preconfigured dashboards into your Grafana instance or cloud stack using the UI or the HTTP API.
In order to import it through the UI, follow these steps:
- Click Dashboards in the primary menu.
- Click New and select Import in the drop-down menu.
- Perform one of the following steps:
- Upload a dashboard JSON file.
- Paste a dashboard URL above or ID into the field provided.
- Paste dashboard JSON text directly into the text area.
- (Optional) Change the dashboard name, folder, or UID, and specify metric prefixes, if the dashboard uses any.
- Select a data source, if required.
- Click Import.
- Save the dashboard.
The following are examples of the metrics available within the Grafana dashboards:
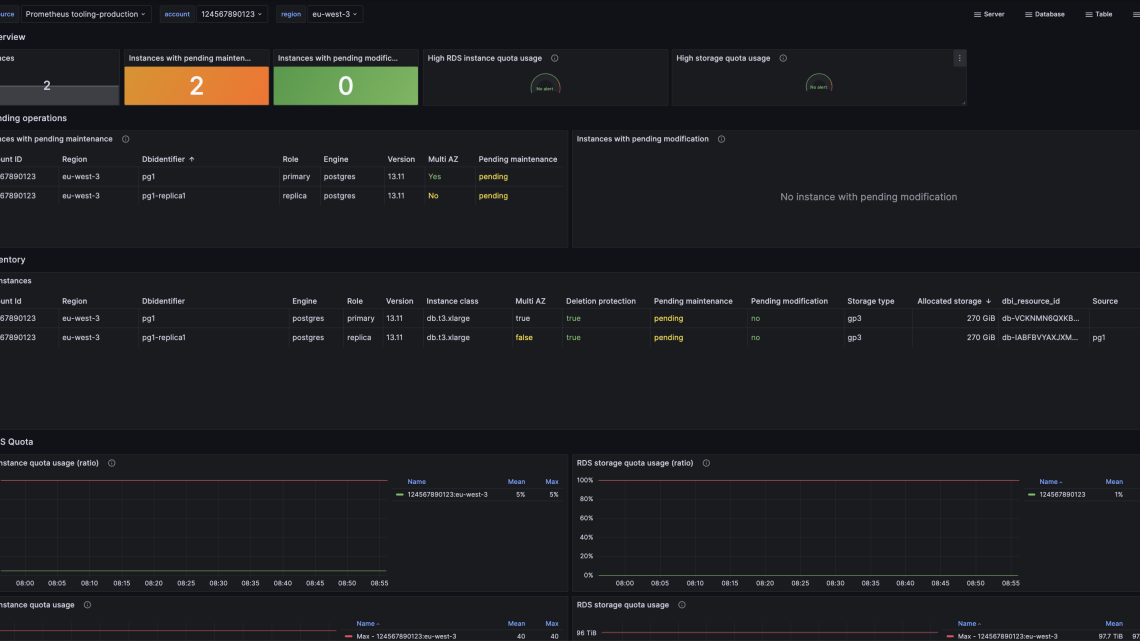
Amazon RDS inventory
Use the RDS inventory dashboard to visualize Amazon RDS instances with pending maintenance or modifications.

Amazon RDS instance overview
Use the RDS details dashboard to see Amazon RDS instance resources usage via the USE method.

Step 5: Install Amazon RDS alerts
After gathering metrics, we can now visualize them and proceed to activate the alerts. Qonto’s Database monitoring framework contains:
- 30 recommended alerts for Amazon RDS
- A Helm chart to deploy Prometheus alerts
- Documented runbooks to handle Amazon RDS alerts.
Install the RDS alerts helm chart containing the recommended Amazon RDS alerts. These alerts are defined as PrometheusRule CRD and will be automatically detected by Prometheus.
By default, the deployment includes 30 predefined alerts for Amazon RDS. To customize alerts (e.g. adjust alert threshold to your database workload), you can find a list of available configuration options in the Helm configuration file.
Clean-up
1. Uninstall the Prometheus alerts:
2. Uninstall the Prometheus RDS Exporter:
3. Delete the Kubernetes Service Account used by the Prometheus RDS Exporter:
4. Delete the Kubernetes Service Account and the IAM Role associated with this service account
5. Delete the IAM Policy
6. Remove Grafana Dashboards:
Finally, navigate to your Grafana instance UI, go to Dashboards > Manage and select the dashboards you imported and delete them.
Conclusion
Having a unified approach to database monitoring can be beneficial to database administrators with tens or hundreds of databases, saving time and deploying best practices at scale. Using Qonto’s framework, which is based on AWS services and their years of experience, you can improve your observability tooling today and help your business scale further with lower risk.
PostgreSQL users might also be interested in deploying the PostgreSQL alerts.
